
From Rocket Speed to Litespeed: A 50× Faster Server Response Without Sacrificing Core Web Vitals
TL;DR: A WordPress site running on our LiteSpeed platform was using WP Rocket for caching, yet still scored just 49 on mobile with a 7.4-second Largest Contentful Paint. We switched it to LiteSpeed’s native server-level cache (LSCache), then layered the front-end optimisations on top, cutting Time to First Byte from roughly 500 ms to about 9 ms (a ~50× improvement) and lifting the mobile Lighthouse score to 94. The lesson underneath it is the part worth your time: a fast server response and good Core Web Vitals are two different problems, and you need to solve both.
The brief
One of our agency partners brought us a site that looked fine on the surface and asked a fair question: could it be faster? The specifics:
- A WordPress site built in Elementor for a property-services business, actively running an SEO campaign, so rankings and Core Web Vitals genuinely mattered to the commercial outcome.
- Hosted on Black Label Hosting’s LiteSpeed Enterprise stack.
- Caching handled by WP Rocket, configured with the usual front-end optimisations, CSS and JavaScript minification, deferred and delayed JavaScript, unused-CSS removal, and lazy-loading.
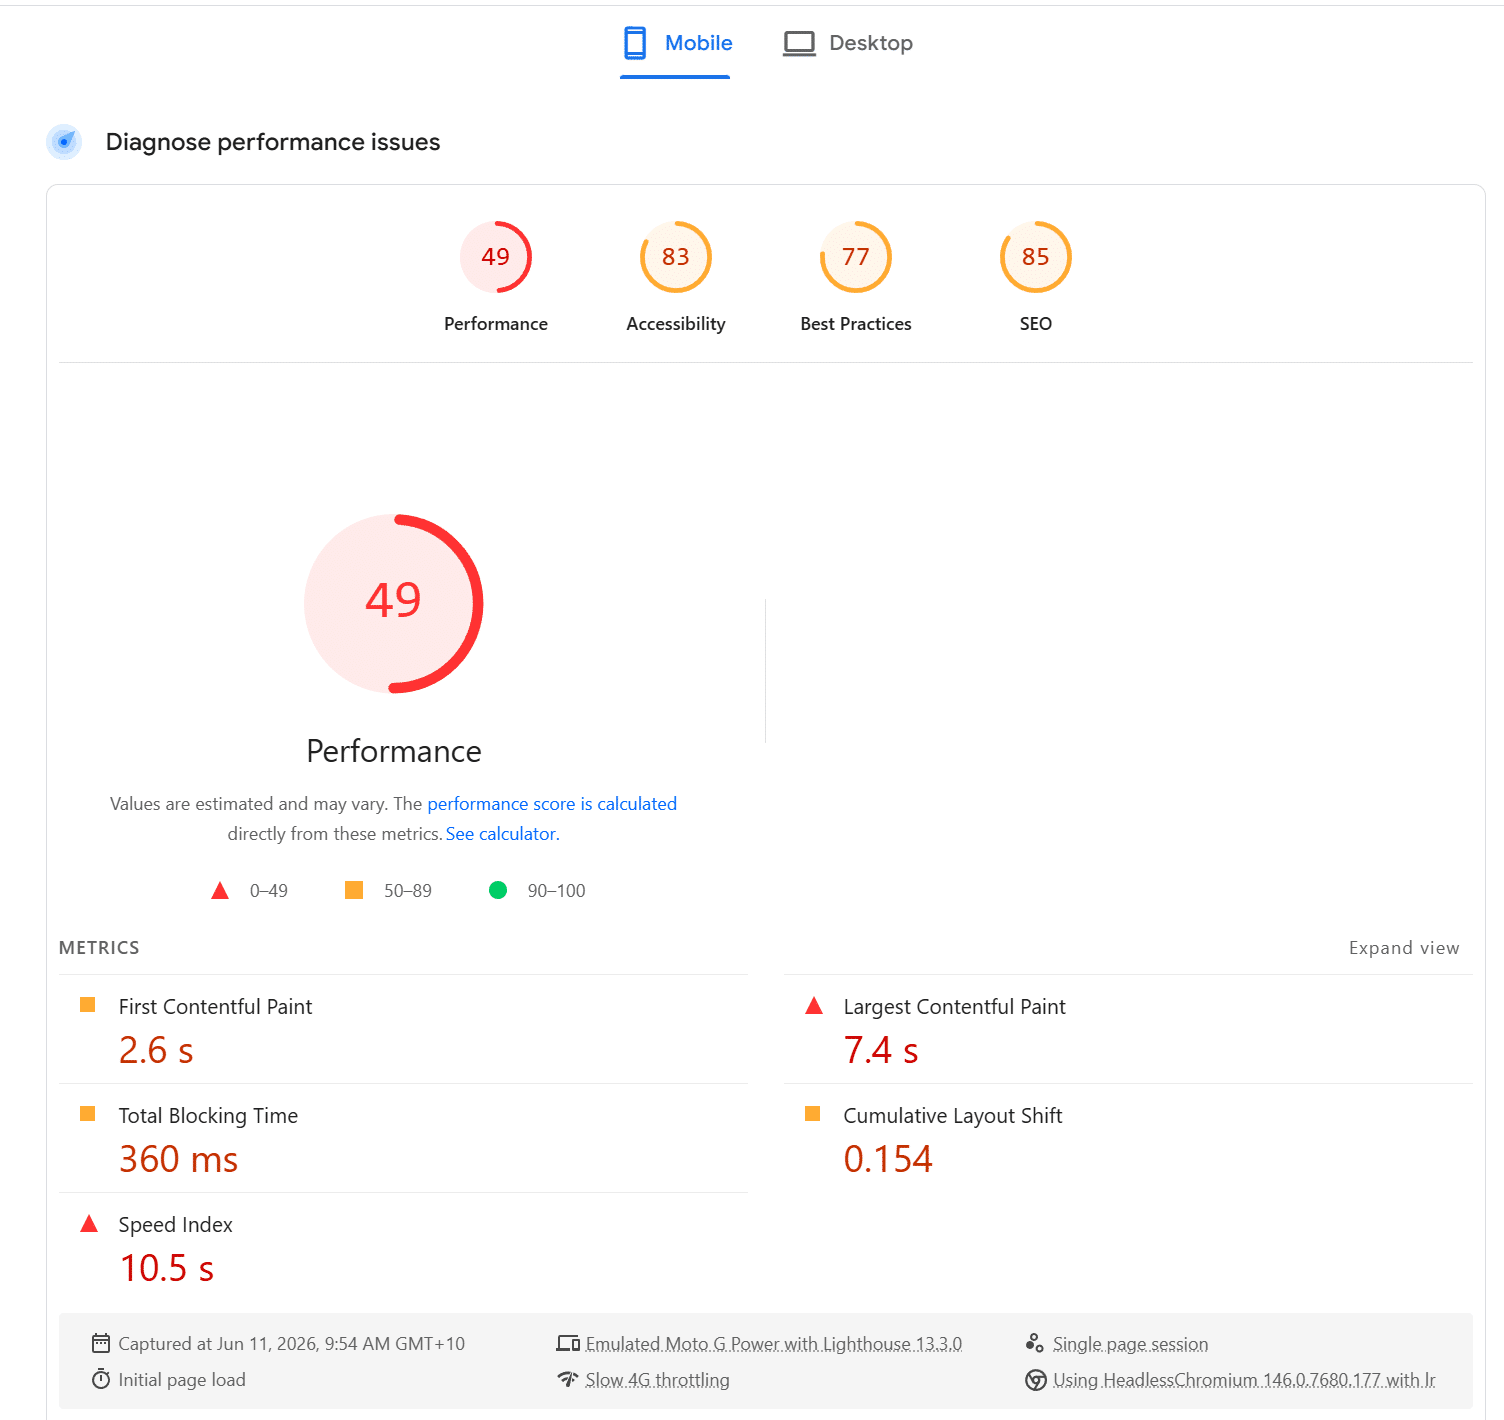
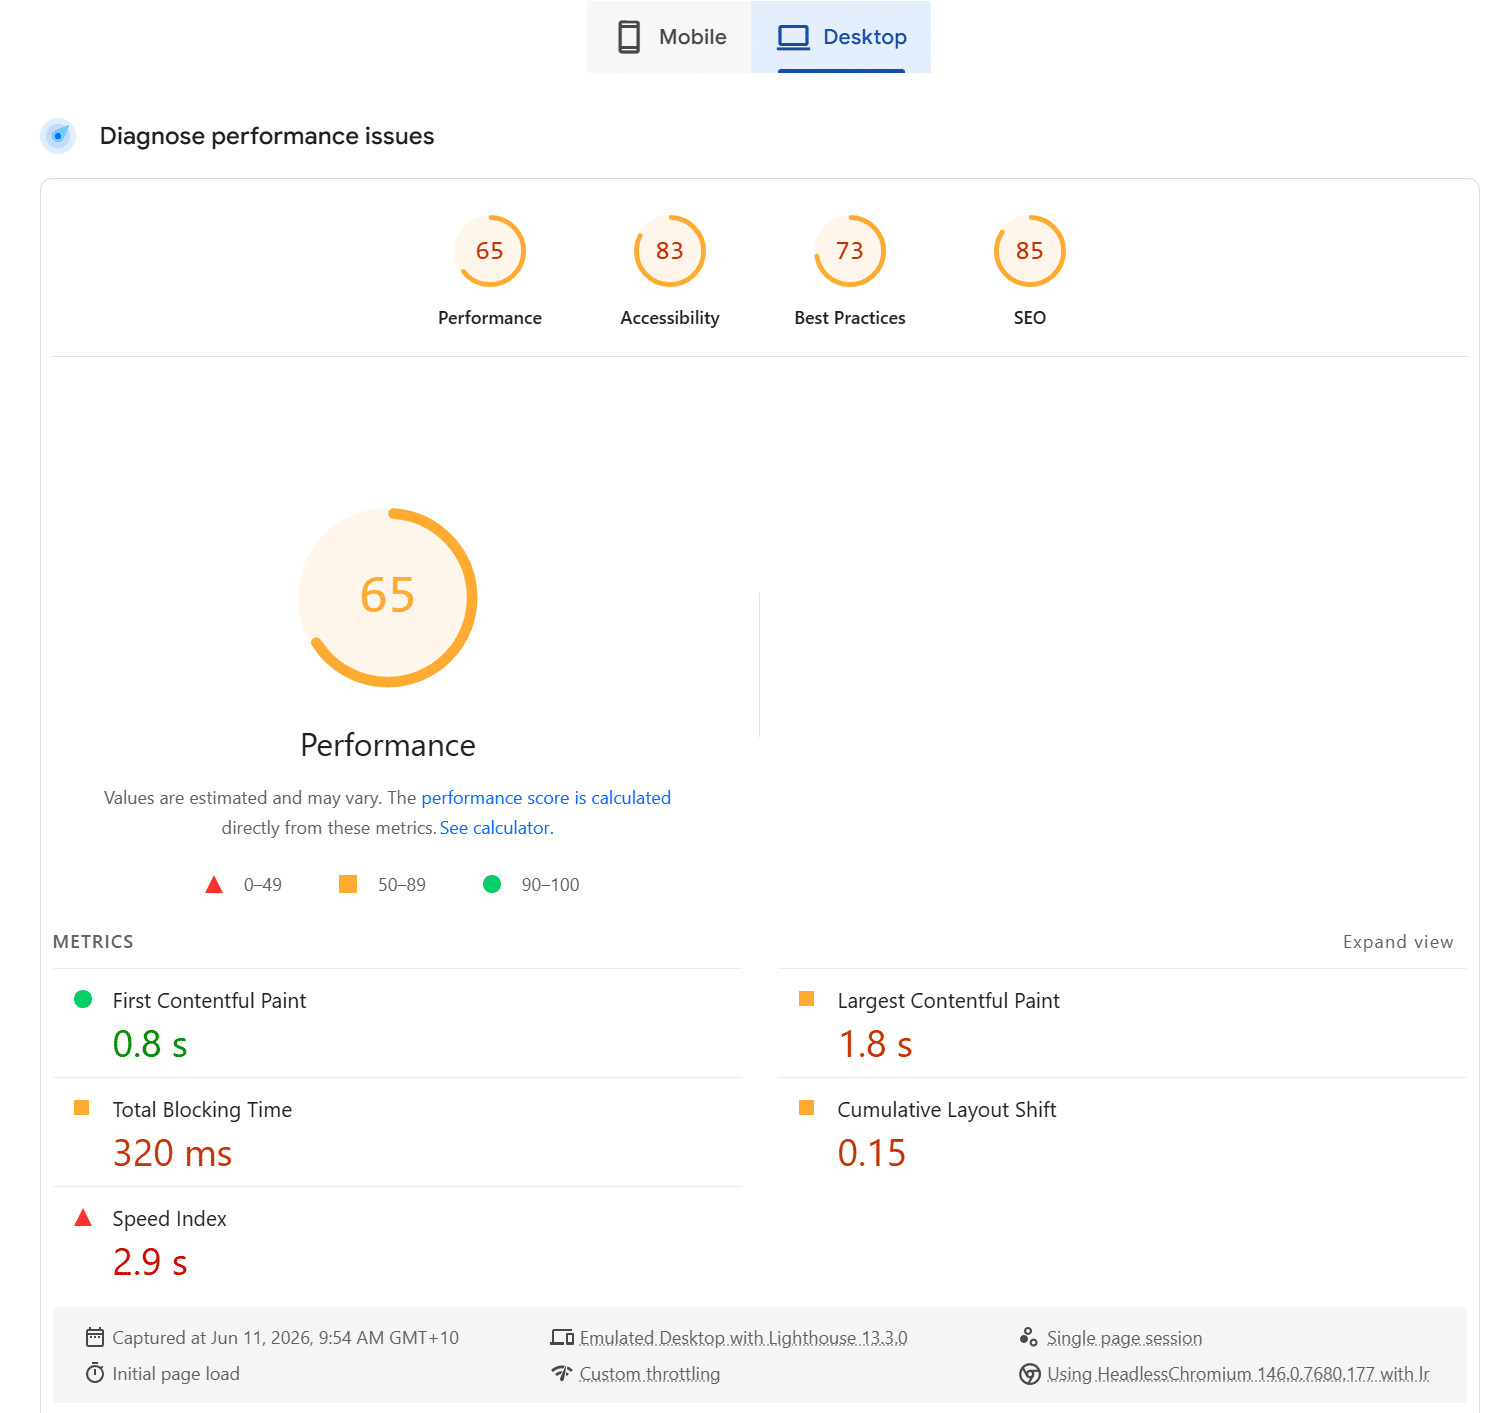
Despite that configuration, the JavaScript-heavy Elementor build was holding the numbers back. On mobile it was scoring 49, with a 7.4-second LCP and a 10.5-second Speed Index; desktop sat at 65. This is exactly the kind of site where the defaults are not enough, and where there is real headroom to recover. Here is where it started:
The key insight: match the cache to the server
WP Rocket is a first-class page-cache plugin, but it is designed for Apache and Nginx, where it generates static HTML files for the web server to hand out. On a LiteSpeed server, page caching is best handled natively by LiteSpeed Cache (LSCache), which serves a cached page at the server layer, before PHP or WordPress even loads. Same site, same content, same markup, but a fundamentally shorter delivery path.
That difference is not a tuning preference; it is architectural. A plugin cache still has to boot PHP, load WordPress, and run the plugin far enough to return the cached HTML. A server-level cache answers the request before any of that happens. On LiteSpeed hardware, that is the single biggest lever available, and it costs nothing but the right configuration.
Measured origin-direct (server response time, TTFB):
| WP Rocket (on LiteSpeed) | LiteSpeed Cache | |
|---|---|---|
| TTFB | ~440-660 ms (full render, the plugin cache isn’t served at the server layer) | ~9 ms (served from server-level cache) |
| Improvement | – | ~50-70× faster |
First, a plain-English primer: what these metrics actually measure
Performance reports are an alphabet soup of acronyms, and it is easy to chase a single number without understanding what it represents. Before we go further, here is what each metric actually measures and why Google, and your visitors, care about it. This matters because the rest of the case study turns on the difference between them.
TTFB, Time to First Byte
The time from the moment a browser asks for the page to the moment the first byte of the response arrives. It is a measure of how quickly your server responds. TTFB is not itself a Core Web Vital, but it sits underneath all of them: nothing else can start until the first byte lands, so a slow TTFB pushes back every other metric on the page. This is the number server-level caching transforms.
FCP, First Contentful Paint
When the first piece of real content, text or an image, appears on screen. It is the visitor’s first signal that the page is actually loading rather than hanging. Google considers under 1.8 seconds “good”.
LCP, Largest Contentful Paint
When the largest visible element, usually the hero image or headline, finishes rendering. LCP is one of the three Core Web Vitals and a direct measure of how quickly the main content becomes usable. Google’s “good” threshold is under 2.5 seconds. Because it tracks the main content, LCP is heavily influenced by both server response time and how images and fonts are delivered, which is why this site’s 7.4-second mobile LCP was the clearest symptom of the problem.
Speed Index
How quickly the visible part of the page is populated as it loads, effectively, how fast the page looks finished. A page can paint something early (good FCP) but still feel slow if the rest fills in sluggishly; Speed Index catches that.
TBT, Total Blocking Time
The total time the browser’s main thread is blocked by long JavaScript tasks while the page loads, time during which the page cannot respond to taps, clicks or scrolls. TBT is driven almost entirely by how much JavaScript runs and when. It is a lab-measured proxy for real-world interactivity, which is why it is the metric that moves when you defer or delay scripts.
INP, Interaction to Next Paint
The newest Core Web Vital, which replaced First Input Delay in March 2024. INP measures how quickly the page visually responds when a real user interacts with it, tapping a menu, opening an accordion, submitting a form. Google’s “good” threshold is under 200 milliseconds. INP is the field-data cousin of TBT: heavy JavaScript that blocks the main thread is the usual culprit for both.
CLS, Cumulative Layout Shift
A measure of visual stability: how much the page jumps around as it loads because images, ads or fonts arrive late and push content down. It is scored from 0 upward, and Google considers under 0.1 “good”. High CLS is what makes you tap the wrong button because the layout moved underneath your thumb.
Why this matters for SEO, not just user experience
Three of these (LCP, INP and CLS) are the Core Web Vitals, and they are a confirmed part of Google’s page-experience ranking signals. They are measured on real visitors (field data) through the Chrome User Experience Report, not just in a lab test. That has three practical consequences for an SEO campaign:
- Rankings. When two pages are otherwise comparable in relevance and authority, page experience can be the tiebreaker. For a competitive commercial query, that tiebreaker is worth real money.
- Conversions. Speed and stability are not just ranking inputs; they change behaviour. Faster, steadier pages hold attention, reduce bounce, and convert better, which is the actual point of ranking in the first place.
- Crawl efficiency. A faster server response lets Googlebot crawl more of the site in the same crawl budget, so new and updated pages are discovered and re-indexed sooner.
The headline figure people reach for is TTFB, because it is the one that moves most dramatically. But TTFB is necessary, not sufficient, and understanding that distinction is what turned a fast server into a genuinely fast site.
The trap: a blazing TTFB is not the same as good Core Web Vitals
Here is the lesson worth the whole article. When we first enabled LSCache in a caching-only configuration, the server response became outstanding, about 9 ms, but that alone does not move the front-end Core Web Vitals. A page-caching layer, on its own, does not replace the front-end optimisations the site still needs: the minification, the JavaScript defer and delay, the unused-CSS removal.
Put another way: server-level caching makes the server hand over the HTML almost instantly, but it does nothing about what the browser then has to do with that HTML. If the page still ships 30-plus render-blocking scripts, the browser still has to download, parse and execute them, and metrics like LCP, FCP and especially Total Blocking Time are driven by exactly that work on the main thread, not by how fast the first byte arrived. A 9 ms TTFB with an unoptimised front end is a Ferrari engine bolted to a handbrake.
This is the single most misunderstood point in WordPress performance, and it is why “just turn on a cache” advice so often disappoints. The cache fixes the server. It does not fix the browser.
The fix: LSCache plus front-end optimisation
The solution was not to choose between server speed and front-end optimisation, it was to have both. We configured LiteSpeed Cache’s own front-end optimisation layer to do the front-end work properly on this Elementor build:
- CSS and JavaScript minification, trimming the bytes the browser has to download and parse.
- JavaScript delay, deferring 30-plus non-critical scripts until the user first interacts with the page. This is the single biggest lever for Total Blocking Time and INP, because it keeps the main thread free during the critical early moments of the load. It took the mobile TBT from 360 ms down to 70 ms.
- Lazy-loading and image handling, so off-screen media doesn’t compete with the content that matters first.
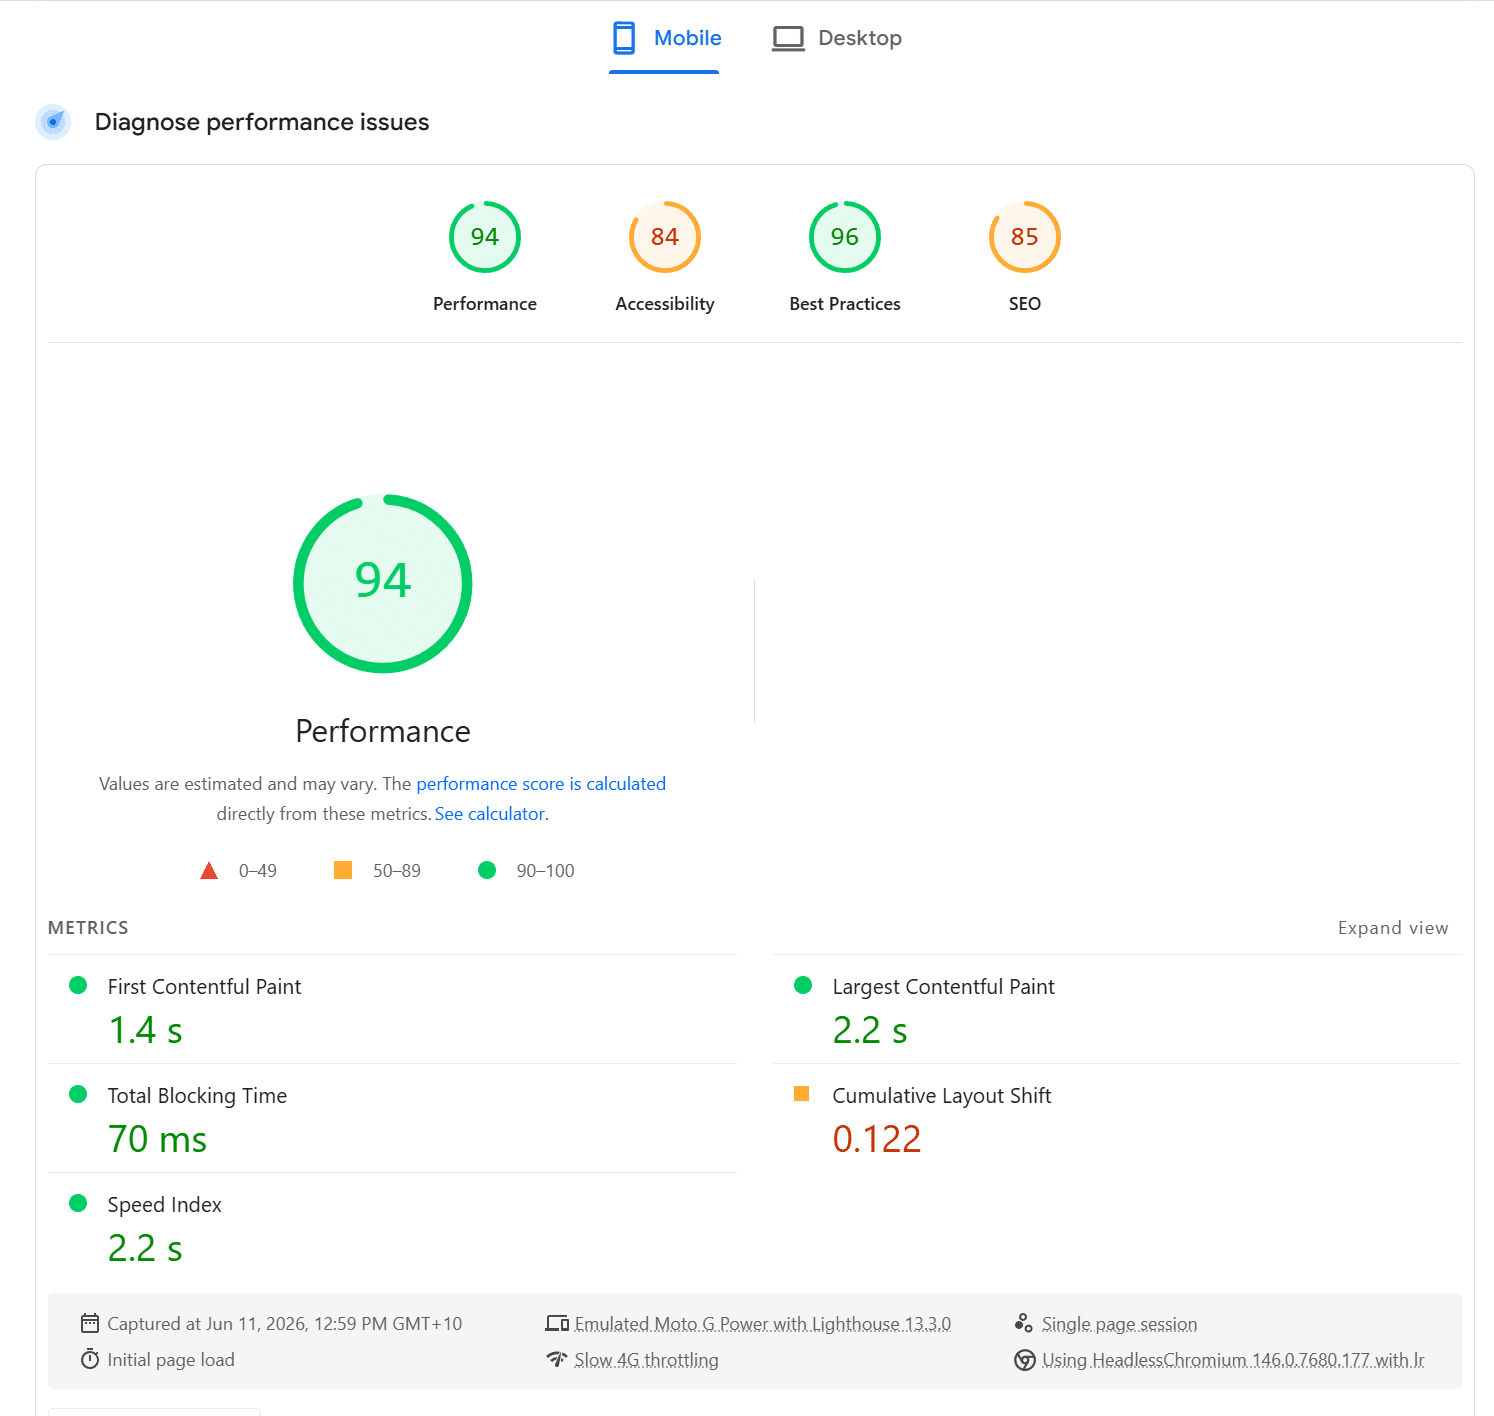
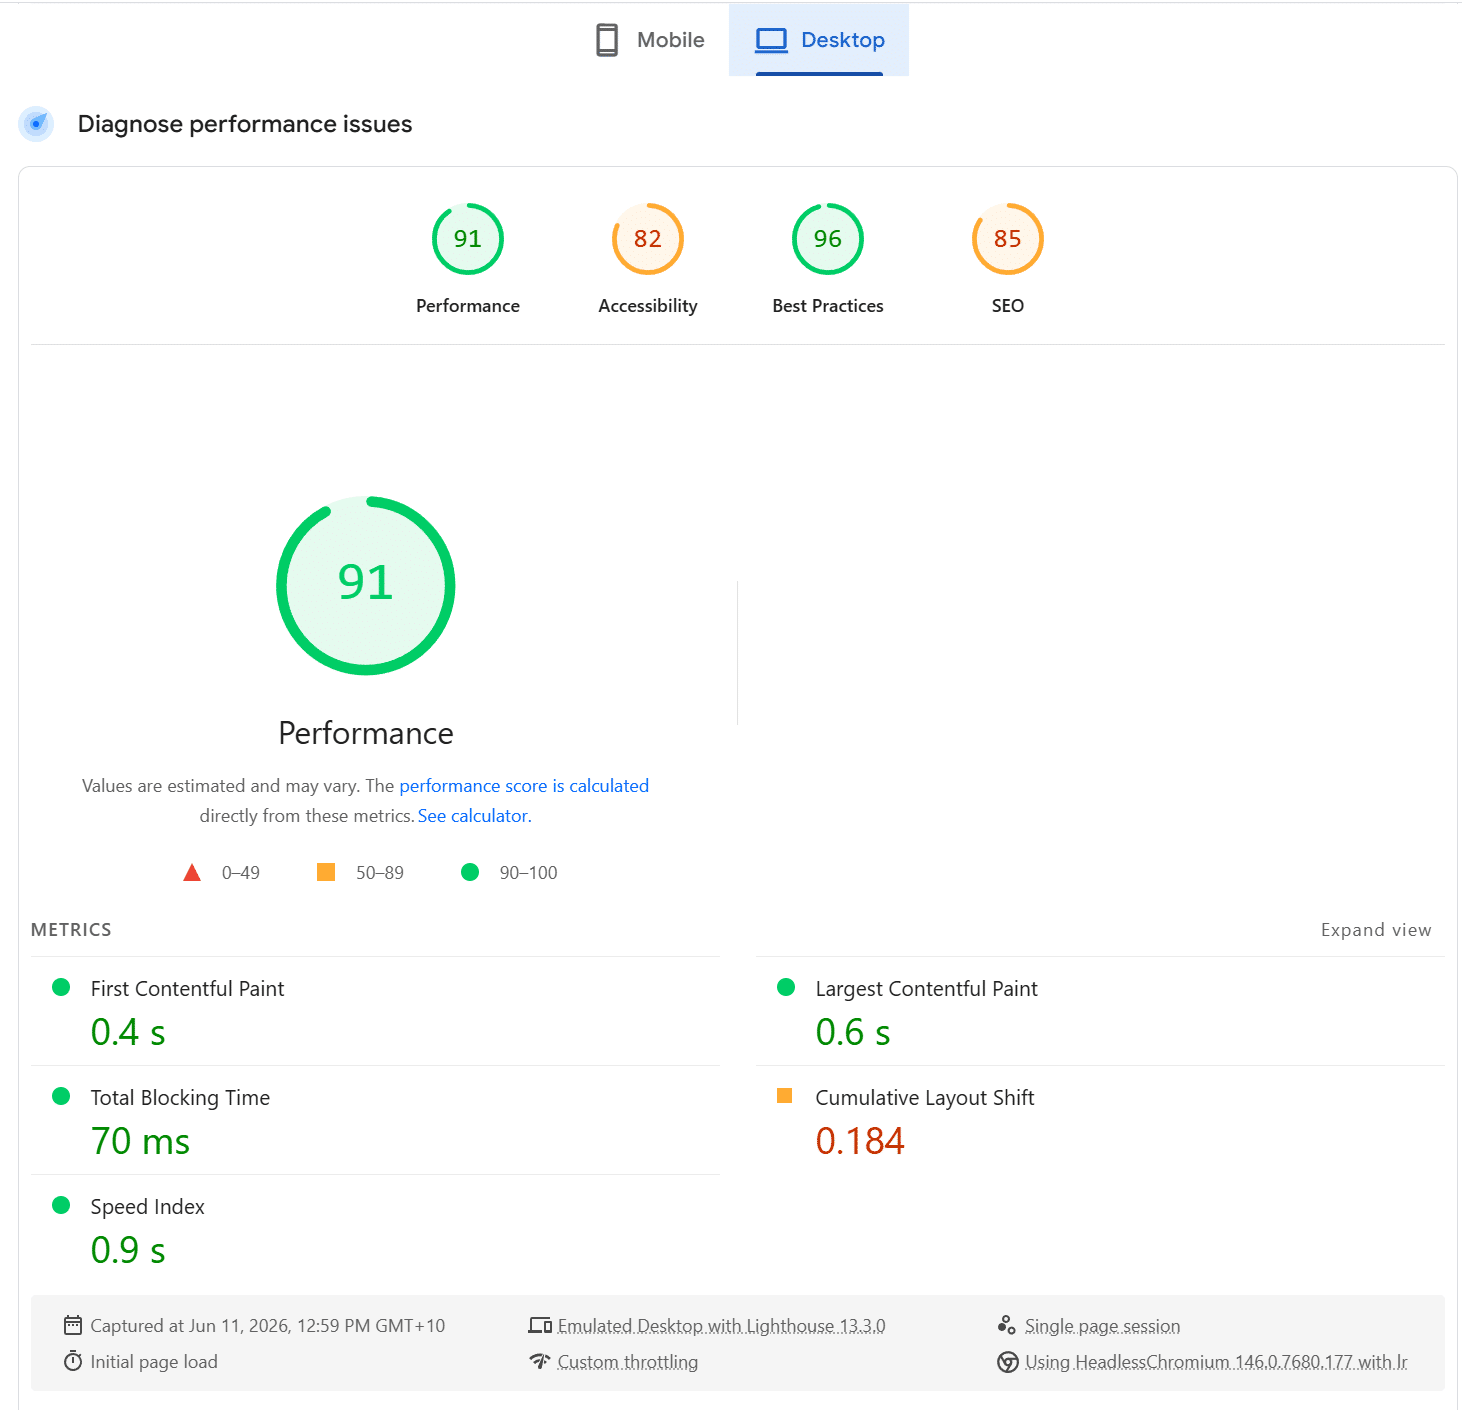
All of this runs on top of the ~9 ms server response, not instead of it. The result is the combination we were after: server-level caching speed and an optimised front end, on the same site. Here is where it landed:
The numbers
Before and after, measured on the homepage with the same Lighthouse version on the same day, so the two are directly comparable. “Good” is Google’s threshold for a passing result.
Mobile (the column that matters most for rankings)
| Metric | Before, WP Rocket | After, LSCache + optimisation | Google “good” |
|---|---|---|---|
| Performance | 49 | 94 | 90+ |
| First Contentful Paint | 2.6 s | 1.4 s | < 1.8 s |
| Largest Contentful Paint | 7.4 s | 2.2 s | < 2.5 s |
| Speed Index | 10.5 s | 2.2 s | – |
| Total Blocking Time | 360 ms | 70 ms | < 200 ms |
| Cumulative Layout Shift | 0.154 | 0.122 | < 0.1 |
| TTFB (server response) | ~500 ms | ~9 ms | < 200 ms |
Desktop
| Metric | Before, WP Rocket | After, LSCache + optimisation | Google “good” |
|---|---|---|---|
| Performance | 65 | 91 | 90+ |
| First Contentful Paint | 0.8 s | 0.4 s | < 1.8 s |
| Largest Contentful Paint | 1.8 s | 0.6 s | < 2.5 s |
| Speed Index | 2.9 s | 0.9 s | – |
| Total Blocking Time | 320 ms | 70 ms | < 200 ms |
| Cumulative Layout Shift | 0.15 | 0.184 | < 0.1 |
Every loading and interactivity metric improved sharply, and on mobile, the harder, more important test, Performance went from a failing 49 to a passing 94, with LCP, FCP, Speed Index and TBT all inside Google’s “good” band. The one honest exception is Cumulative Layout Shift: it improved on mobile (0.154 to 0.122) but ticked up slightly on desktop (0.15 to 0.184), and it is the single metric still sitting outside the “good” threshold. That makes it the clear focus of the next phase, and it is a layout-stability problem, not a caching one, which is exactly the point about matching the right fix to the right metric.
Why this is a tuning exercise, not a switch-flip
It would be easy to package this as “we turned on the right cache”, but that undersells what actually earns the result. The right configuration depends on the specific site, and JavaScript-heavy builders like Elementor are exactly the case where the defaults are not good enough. Delay too many scripts and an interactive element breaks; delay too few and Total Blocking Time stays high. Strip the wrong CSS and the layout shifts. Getting the balance right is iterative, and it is the part that genuinely benefits from someone who does it every week.
For our agency partners, that is the whole point of managed hosting: the platform gives you the architectural advantage, server-level caching that a plugin simply cannot match, and the management layer makes sure the front-end tuning keeps that advantage without breaking the site sitting on top of it. You get to promise your clients speed and stability, and have the numbers to back it.
What’s next: the roadmap
There is still headroom, and we know where it is. The remaining work centres on Cumulative Layout Shift and the last of the render-path timing: reserving explicit space for late-loading elements (images, fonts, embeds) to stop the layout shifting, and connecting QUIC.cloud, LiteSpeed’s content-delivery and optimisation network, to generate Critical CSS and per-page Unused-CSS removal automatically, and to push static assets closer to visitors at the edge. That targets FCP, LCP and Speed Index specifically. Performance work on a live commercial site is rarely “done”; it is a sequence of levers pulled in the right order, measured each time.
Key takeaways
- On LiteSpeed hosting, use the native LiteSpeed Cache. Plugin caches built for Apache or Nginx cannot match server-level caching for TTFB, the delivery path is fundamentally shorter.
- TTFB is necessary but not sufficient for Core Web Vitals. Pair fast caching with proper front-end optimisation, minification plus JavaScript delay, or a brilliant server response gets squandered in the browser.
- The combination wins. A sub-10 ms server response and a 94 mobile score is exactly what Google’s ranking signals, and real users, reward.
- It is a tuning exercise, not a switch-flip. The right configuration depends on the site, especially JavaScript-heavy Elementor builds, which is where managed hosting earns its keep.
Frequently asked questions
Is LiteSpeed Cache better than WP Rocket?
On a LiteSpeed server, yes, for page caching specifically. LiteSpeed Cache serves pages at the server layer before PHP or WordPress loads, which WP Rocket cannot do because it is built for Apache and Nginx. On non-LiteSpeed hosting, WP Rocket remains an excellent choice. The right answer depends on the server your site runs on, which is the core point of this case study: match the cache to the server.
Will switching caches hurt my Core Web Vitals?
It can, if you only enable caching and stop there. Server-level caching transforms TTFB but does not replace front-end work like minification and JavaScript delay. To keep, or, as here, dramatically improve, Core Web Vitals, you need to re-apply those front-end optimisations on top of the new cache. Done properly, you get both.
What is a good TTFB?
Google suggests aiming for a server response time under 200 milliseconds. Server-level caching on LiteSpeed routinely beats that by a wide margin, in this case landing around 9 milliseconds, because the cached page is served before the application stack even loads.
Do Core Web Vitals actually affect SEO rankings?
Yes. LCP, INP and CLS are part of Google’s page-experience ranking signals, measured on real visitors. They are most decisive as a tiebreaker between pages of similar relevance and authority, and they also improve conversions and crawl efficiency, so the benefit compounds well beyond the ranking itself.